

Gold gets time, but no answers
Since the January peaks, gold and silver have fallen in value by around 30 and 50 percent respectively. Macro strategist and precious metals specialist Willem Middelkoop calls it a classic correction.
From current price levels, he expects a further decline of 10 to 20 percent. Against that, he sees upside potential of 100 to 200 percent. If that assessment is correct, an asymmetric buying opportunity emerges. The potential loss is then relatively limited compared with the potential gain.
Middelkoop has, in any case, started buying again below a silver price of 60 dollars. "At 55 dollars I'll buy even more. At 50 dollars I'll go all in," says Middelkoop. At the time of writing, the silver price is trading at 58 dollars per ounce.
From a technical perspective, that reasoning seems to hold up for silver. The 100-week exponential moving average sits around 53 dollars. That level, for example, acted as important support for the silver price during Trump's trade war in April 2025.
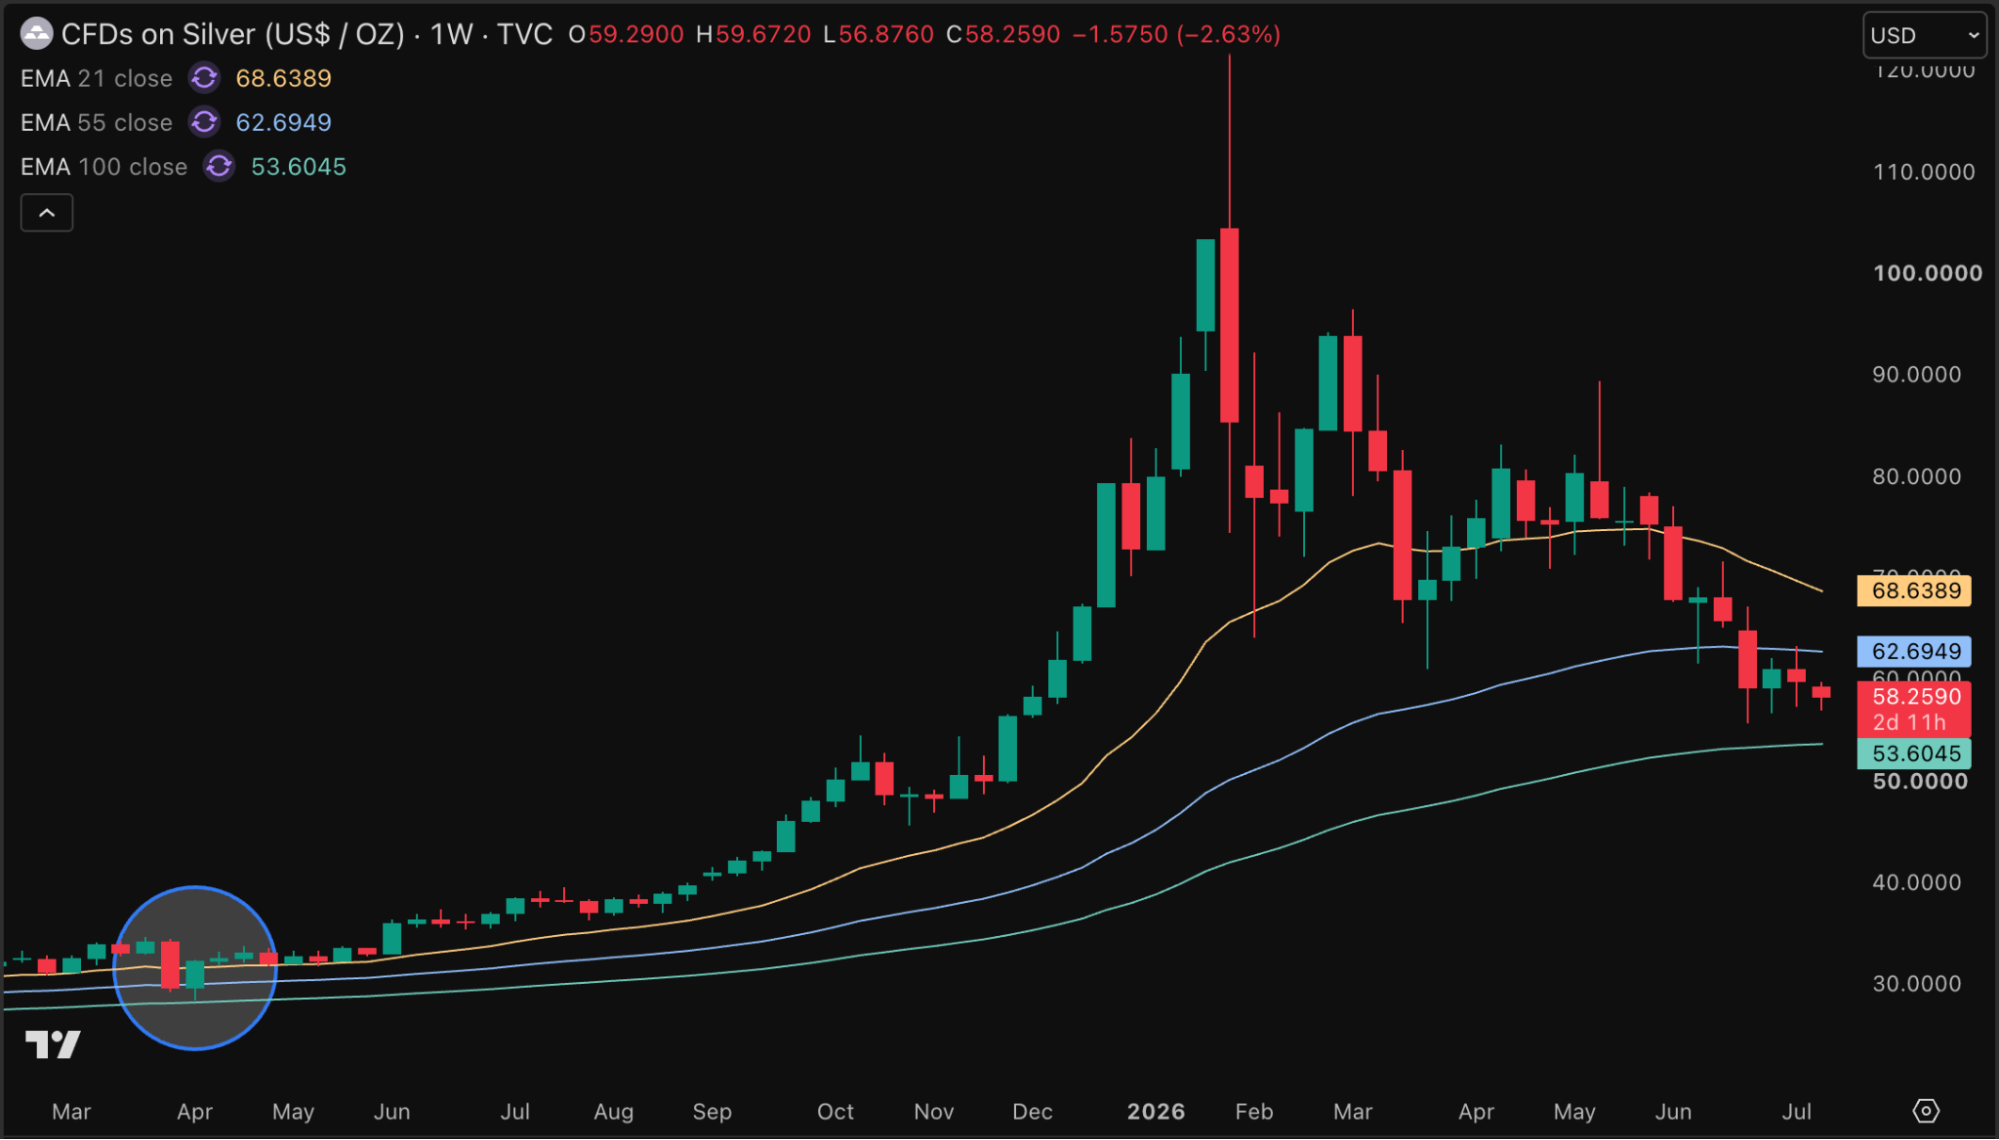
If silver falls further, it's plausible that the price will find renewed support around that level. Right now, however, silver is technically still somewhat stuck in no man's land. There's no sign yet of convincing positive momentum.
Investors can choose to wait for that. One possible confirmation signal would be reclaiming the 55-week exponential moving average around 62 dollars, shown by the blue line in the chart above.
Entering now carries more risk, but that comes with greater potential returns as well. Middelkoop, in any case, is willing to take that risk.
The market gets time, but no answer
That's the technical side of the story. But for precious metals, the macroeconomic context also continues to play an important role. On that front, this week was dominated by US inflation figures, which turned out to be much softer than expected.
It started on Tuesday with the Consumer Price Index (CPI). That report gave the market some breathing room, particularly because core inflation came in lower than expected. That's the version of the CPI that excludes energy prices, telling central bankers to what extent the rise in oil prices is feeding through into other parts of the economy.
That turned out better than feared, and the same applied to the Producer Price Index (PPI) that followed a day later. As a result, the market suddenly expects a much less strict US central bank. Beforehand, markets were pricing in around one and a half rate hikes for 2026 and saw a 50 percent chance of a rate hike in July.
At the moment, the market is pricing in only around one rate hike for the whole of 2026, while the odds of a hike in July have fallen to 10 percent.
That shifting picture is clearly visible in the US 2-year yield. That yield serves as a fairly direct gauge of expectations around the central bank's interest rate policy.
After the resumption of the war with Iran, the 2-year yield shot up. Investors feared that a higher oil price would reignite inflation and force the central bank into rate hikes. After the two cool inflation readings, however, a sharp decline followed.

In theory, that should give the gold price some room to breathe. That did happen briefly, particularly after the cool consumer price index. However, there was no real breakout in the gold price, and the same applies to the silver price. That's probably related to the fact that the market still doesn't have enough certainty.
The cooler inflation prints are positive developments, but the resumption of the Iran war hangs over the market like a dark cloud. The United States and Iran continue to attack each other back and forth, causing the market to grow increasingly concerned about a years-long conflict.
As a result, the oil price is likely to remain elevated for a long time, particularly because this creates the risk of a new sharp rise to above 100 dollars per barrel.
The cool inflation figures are therefore mainly giving the market time to catch its breath. However, they don't yet provide a definitive answer to the most important questions.
The war with Iran could, after all, still take a painful turn. If the oil price rises sharply again, inflation could climb once more. In that case, the US central bank may still need to act more strictly than the market currently expects.
The most important decisions have therefore mainly been pushed back. This week's inflation figures reduce the odds of a July rate hike, but shift the discussion to the September and October rate meetings.
For gold and silver, that's favourable for now, but the light isn't fully green yet. As long as the war with Iran continues, macroeconomic uncertainty remains high.
The technical foundation is in place for gold
Against this macroeconomic backdrop, it's mainly a matter of patience for gold investors. Meanwhile, the technical foundation for a second phase of the bull market appears to be forming ever more clearly. Both gold and silver are showing more bottoming signals.
The gold price, for instance, is holding up remarkably strongly around the 4,000 dollar per ounce level. On the daily chart, there's also a bullish divergence. The gold price set a lower low, while the Relative Strength Index (RSI) formed a higher low instead. This is marked with white arrows in the chart.
Such a divergence usually indicates that downward momentum is losing strength. Sellers are still managing to push the gold price to a lower level, but the underlying selling pressure is easing.

At the same time, the zone around 4,000 dollars remains an important support for now. For a convincing technical breakout, gold will then need to reclaim several key moving averages.
The first of these is the 21-day exponential moving average around 4,132 dollars, shown in yellow on the chart. After that comes the 55-day exponential moving average around 4,313 dollars, shown in blue.
If gold manages to reclaim these moving averages, and this coincides with an improvement in macroeconomic conditions, that could form the ideal foundation for the next phase of the bull market.
Gold and silver have fallen sharply from their peaks but are showing fresh bottoming signals. Discover the key technical levels and what cooler US inflation data means for the gold price.

Thom Derks writes for GoldRepublic on gold, macro-economics and geopolitics. He studied Law in Leiden and Economics in Amsterdam. His personal fascination with scarcity and store of value through both bitcoin and gold brought him into the world of financial journalism. Through his own newsletter De Geldpers on Substack, he reaches over 5,800 subscribers with analyses on markets, geopolitics and the monetary system.