Platinum is a rare precious metal with exceptional properties. It is wear-resistant, corrosion-resistant and has a high melting point. Therefore, platinum is widely used in automotive, jewellery and medical applications.
As an investor, it is essential to monitor the platinum price closely. This page offers you an in-depth insight into the current platinum price, historical price chart and factors affecting the price.
Get starteD!
The chart shows the current platinum price. This price fluctuates continuously based on supply and demand in global markets.
invest in vat-free platinum
Above you can see the historical platinum price chart over the past 20 years. The chart clearly shows the volatility of the platinum price, with peaks and troughs caused by various economic and geopolitical factors.
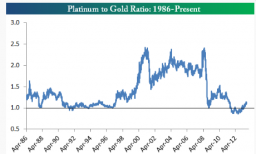
The historical development of the platinum to gold ratio (Source: Bespoke).
The platinum price is largely determined by supply and demand on the NYMEX exchange. On this exchange, wholesalers and institutional investors trade platinum futures contracts. The spot price for physical platinum closely follows the movements of these forward contracts.
Several factors impact the platinum price:
- Mining in South Africa and Russia: these countries are the largest producers of platinum in the world. Strikes, political unrest or natural disasters may disrupt supply.
- Automotive industry demand: platinum is used in catalytic converters for diesel cars. Rising demand from this sector may drive up the price.
- Investment demand: platinum is regarded as a safe investment, just like gold. In uncertain economic times, demand increases.
Platinum value is extremely volatile compared to other precious metals. This is due to limited supply and concentrated production in only a few countries. Small disruptions in supply or demand lead to sharp price fluctuations.
The table below shows the annual return of platinum over the past 10 years, expressed in euros and dollars:
get started
Platinum Price Performance Table: Annual Change
| |
Euro (EUR)/oz |
Dollar (USD)/oz |
| 2014 |
-1,4% |
-12,8% |
| 2015 |
-20,4% |
-27,8% |
| 2016 |
+6,9% |
+3,3% |
| 2017 |
-11,1% |
+2,5% |
| 2018 |
-10,0% |
-15,3% |
| 2019 |
+24,3% |
+22% |
| 2020 |
-0,1% |
+9,6% |
| 2021 |
+5,4% |
+14,4% |
| 2022 |
+15,6% |
+9,2% |
| 2023 |
-10,4% |
-7,6% |
| Average |
-0,1% |
-0,3% |
Bron: LBMA
Note: calculation based on end of year gold prices
Want to buy physical platinum as an investment? At GoldRepublic, you only pay a small 'spread' on top of the spot price. This spread covers our procurement costs at the smelter. Please contact us today for your platinum purchase.
yes, i would like to open an account!
Do you already own platinum and want to sell it? GoldRepublic offers you an attractive bid price based on the current platinum price. The sale is fast, secure and transparent.
Your precious metal must have been purchased from and stored with GoldRepublic.
- The relationship between gold and platinum prices over the years
- The platinum/gold ratio: an important indicator for investors
- How the palladium price influences the platinum price
- The role of platinum recycling in price formation
- Historical peaks and troughs in the platinum/gold ratio.
![]() £0.00/ kg
£0.00/ kg
