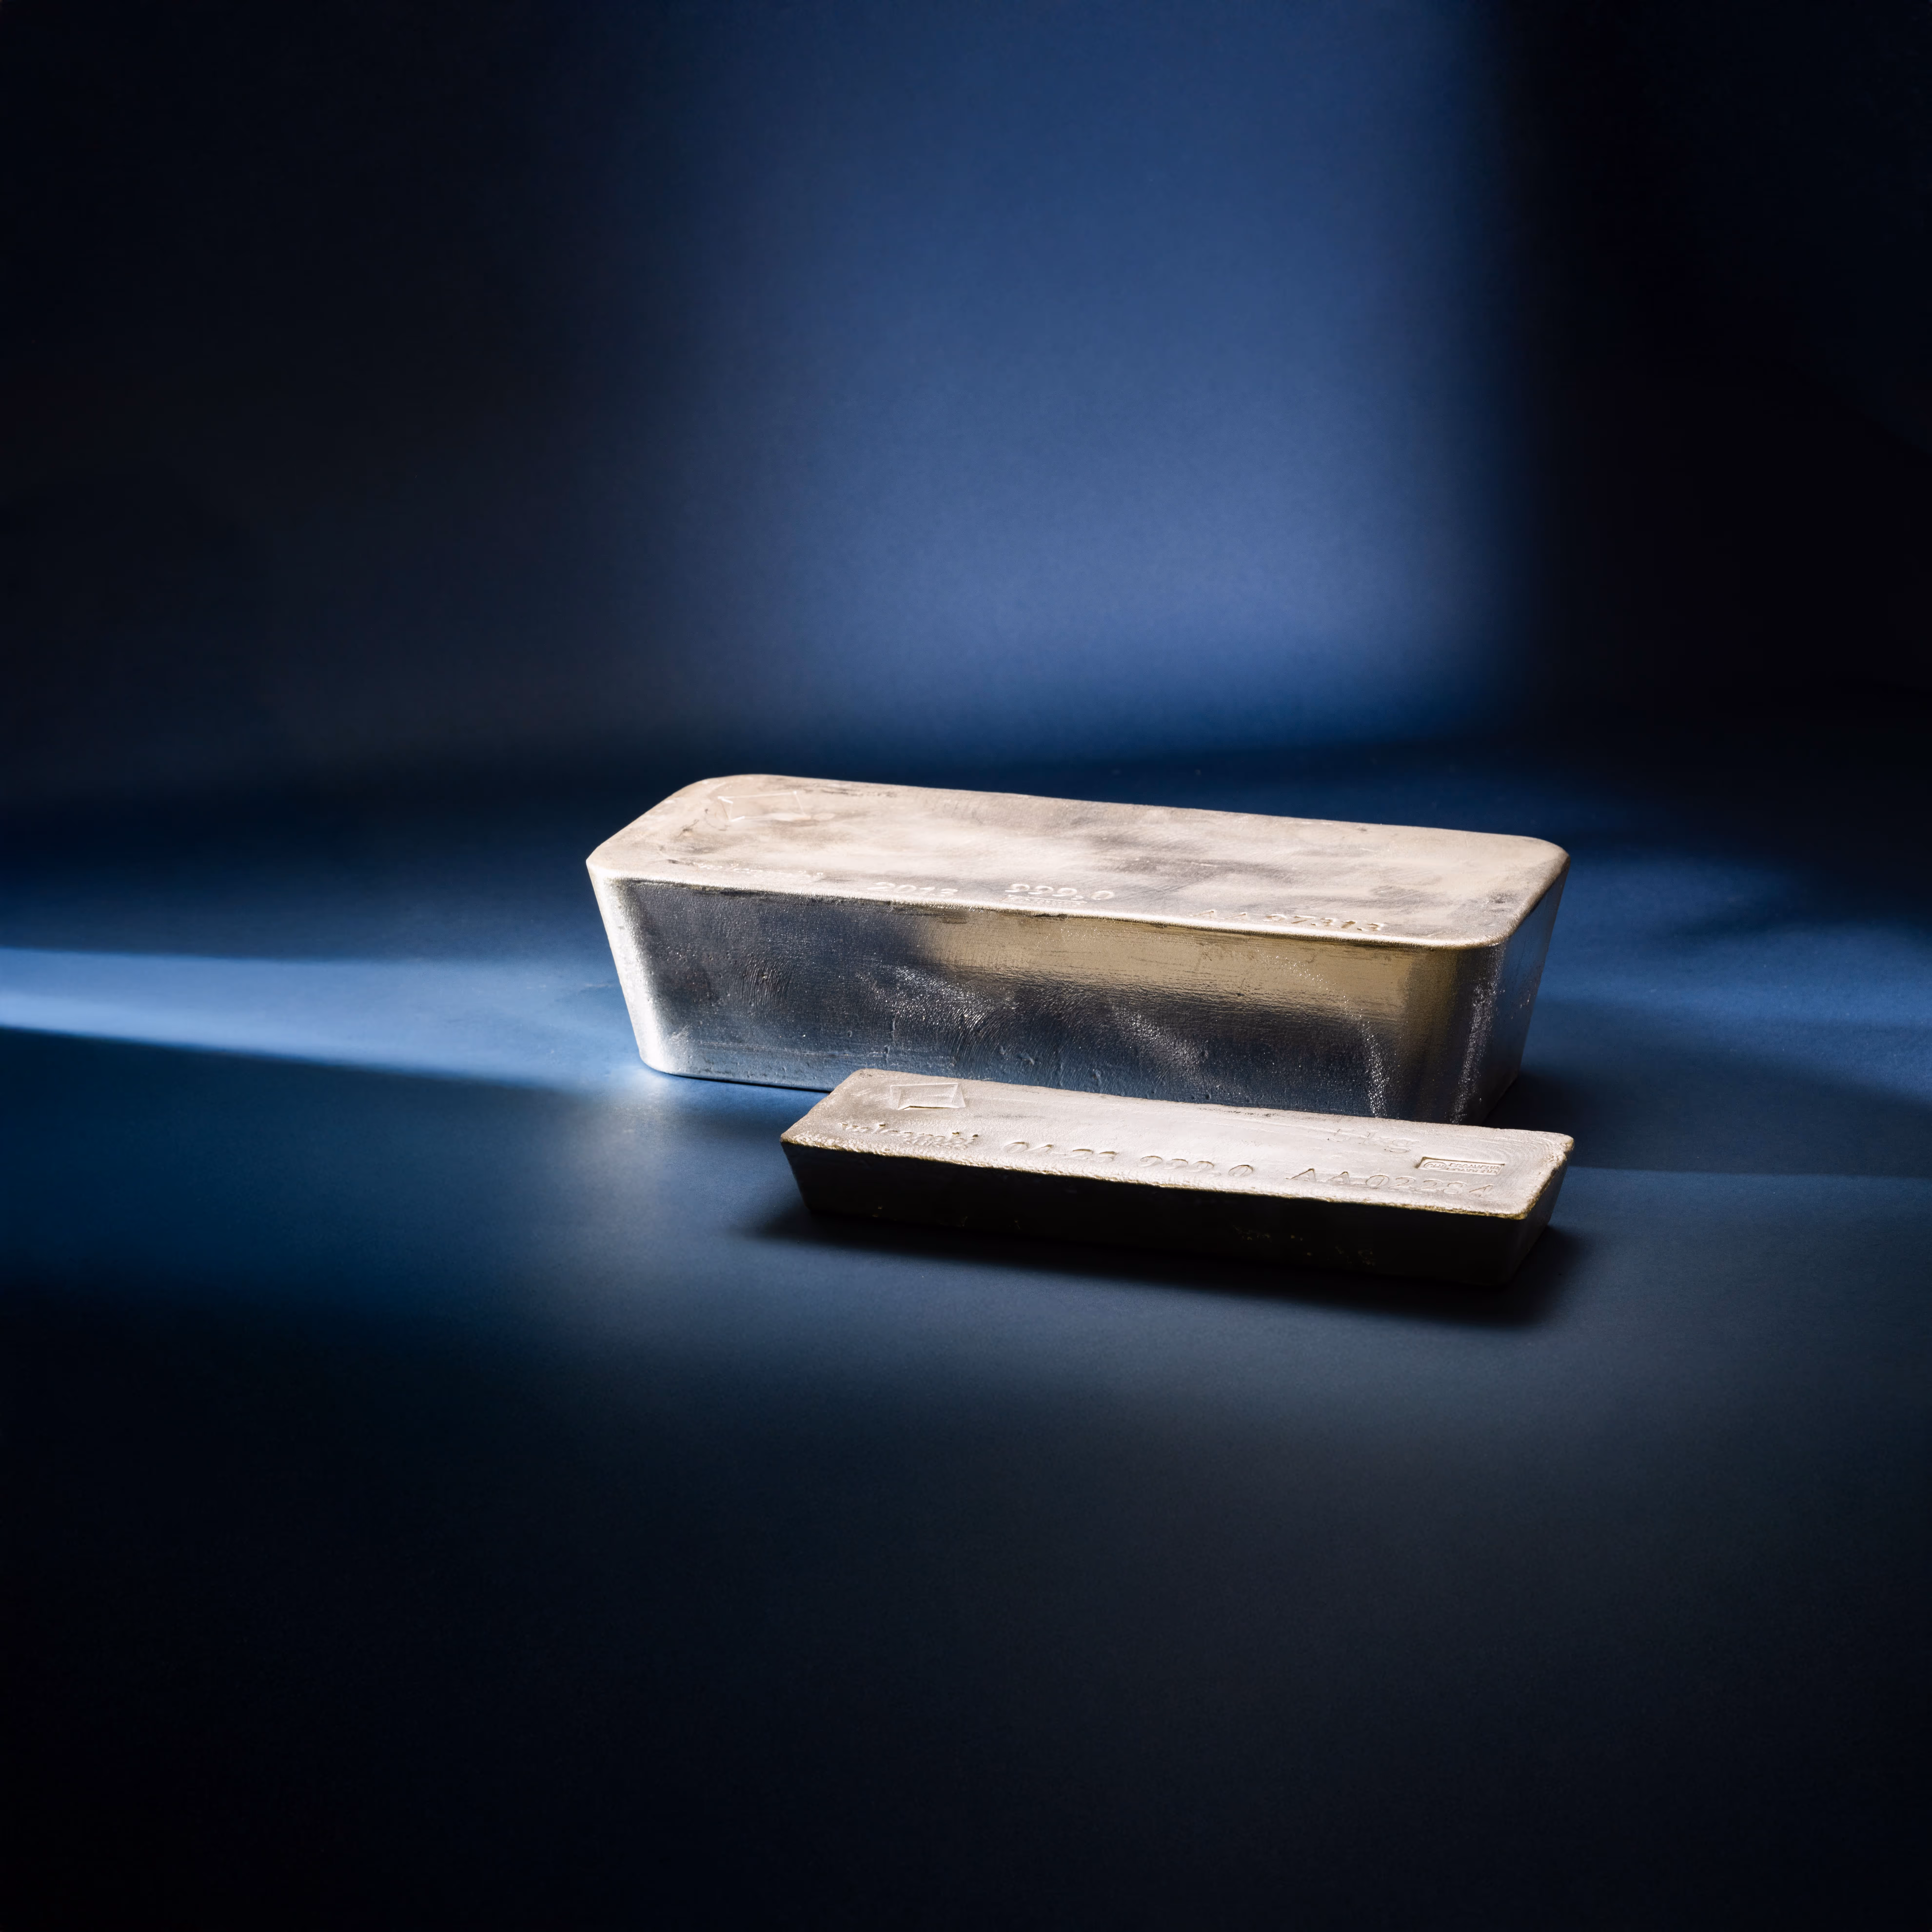
X
GoldRepublic
View

Before we embark upon our forecasts for 2017 (especially regarding precious metals prices), it is without a doubt worth it to analyze the year 2016 once more with the help of a few charts. These charts represent the protagonists of past year, the returns on the most important financial assets and the most important changes in some select financial data. In some cases, these will remain as important as they were last year in the coming twelve months. We will glance through the Dow Jones, German government bonds, the dollar (against the euro), the number of worldwide corporate defaults, the yield curve spread, China´s dollar reserves, the dollar-LIBOR, the oil price, bitcoin and of course the gold price.

Chart #1: The Dow Jones

Source: ST LOUIS FED

Chart #2: USD (12-month) LIBOR

Source: ST LOUIS FED

Chart #3: Corporate Defaults

Source: BLOOMBERG

Chart #4: USD/EUR

Source: GOOGLE FINANCE

Chart #5: The Yield Curve Spread

source: st louis fed

Chart #6: China’s Dollar Reserves

source: PEOPLE'S BANK OF CHINA

Chart #7: The Oil Price

source: ST LOUIS FED

Chart #8: The Gold Price

SOURCE: ST LOUIS FED

Chart #9: German Government Bond Yields

BRON: BLOOMBERG

Chart #10: The Bitcoin Price

SOURCE: COINDESK.COM

Newsletter

Sign up for our periodical newsletter to stay informed about the gold and silver markets and special offers.

AFM

GoldRepublic operates under license from the Dutch Authority for the Financial Markets (AFM),
Registration Number 12020650