
Is Now the Moment to Invest in Gold, Silver and Platinum?
April 18 2018
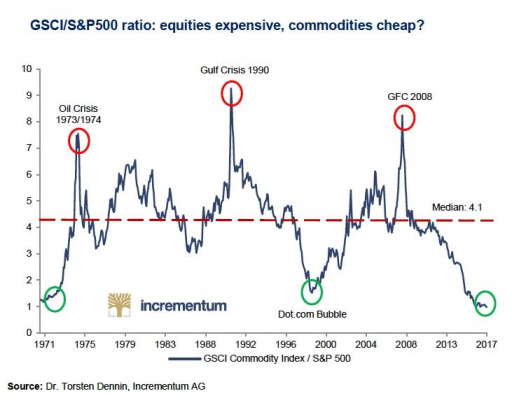
This week I stumbled upon an interesting chart. In this chart, the Goldman Sachs Commodity Index (GSCI), an index tracking the prices of a basket of commodities, is contrasted with the S&P 500 index. This gives us the GSCI/S&P 500 ratio. Whenever the GSCI/S&P 500 ratio is high, we are paying relatively little for stocks in terms of commodities. Conversely, if the ratio is low, we are paying relatively much for stocks relative to commodities. What does the ratio imply right now? Is this the moment to invest in precious metals?
The Commodity/Stock Market Ratio in Historical Context
If we take a glance at the chart that portrays the GSCI/S&P 500 ratio, we can observe a few interesting things:
- If you would have invested at the bottom of 1998, you would have made a fortune
The index reached a bottom of around 1.5 in 1998. If you would have invested in commodities at that point (or just in gold), and would have left stocks for what they were, then you would not only have avoided the dotcom-crash, but also achieved a more than satisfactory annual return. The gold price stood at $290 dollar in 1997/1998. Ten years later, in 2008 (when the commodity/S&P 500 ratio reached a peak of around 8), the gold price reached $1,000 dollar per troy ounce. Not only does this amount to three times as much as in 1997/1998, but it also translates into a compound average annual return (CAGR) of 13.18%. That is not a bad return at all.
Silver prices stood in that same 1997/1998 period around $5 dollar per troy ounce. In 2008, silver prices reached a level of $20 per troy ounce, four times as much. This translates into a (gross) compound average growth rate of 14.9%. Not bad at all!
If in the course of 2008 (say, on January 1, 2009 after the holidays), you would have sold your gold and silver and exchanged it for stocks, then you would have had some truly wonderful returns. Despite the fact that gold and silver prices would only peak in 2011 and outperformed the S&P 500 from 2008 up till their record highs, you would have avoided the crash in the gold market in 2013. The gold price rose with 23.4%, 29.5% and 10.1% in 2009, 2010 and 2011.
- It is rather rewarding to build an investment portfolio around these long-term, secular bull and bear markets
It is clear that the above was not a one-time event. In 1970, 1974, 1990 and, as we have seen above, in 1998 and 2008, this indicator gave the right signals as well. The principle is pretty straightforward: when commodities are relatively cheap compared to stocks, invest in commodities (or precious metals). When commodities are relatively expensive compared to stocks, invest in stocks.
Source: Incrementum AG
Ifs and Buts
Nonetheless, we could also raise some “ifs and buts.” First, we should look at the composition of the Goldman Sachs Commodity Index (GSCI). Which commodities does the index track? Are we correct in equating commodities with precious metals?
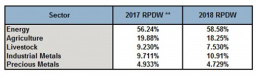
The weights of the underlying commodity categories in the GSCI commodity index. Source: S&P Dow Jones Indices
From the above chart, we can conclude that we most likely cannot equate the commodity index with the precious metals market. Energy (in particular oil and natural gas) has a large weight in the composition of the GSCI index. Precious metals only account for 5% of the GSCI index.
This overrepresentation of crude oil can lead to wrong conclusions. At any rate, commodity prices are generally strongly correlated. For instance, I wrote back in 2015 that: “[B]lack gold, crude oil, has a much stronger and more intimate relationship with gold than most of us realize. If we go back to 1983, we can observe a strong and significant relationship between oil prices and gold prices.”
Despite the fact that oil and gold prices are generally strongly correlated with each other, is the range between both prices fluctuate pretty ample. Let us therefore for a moment look at the gold/oil ratio. The gold/oil ratio can be derived rather simply by dividing the gold price by the oil price.

The gold/oil ratio. Source: Macrotrends.net
In this chart, we can observe that the gold/oil ratio, surprisingly, currently stands at 20. That is to say, the price of an ounce of gold is twenty times the price of a barrel of oil. This could imply that gold is “expensive” relative to gold. Before the 2008 crisis, for instance, the ratio stood at merely 10:1 or even less. All this together means that energy prices are apparently at a cyclical low against precious metals prices. Therefore, precious metals prices seem a bit less favorable than energy prices. This could translate into gold underperforming relative to commodities as a general category (and therefore the GSCI commodity index).
Let us therefore briefly take a look at the S&P 500/gold ratio. How many (troy) ounces of gold does an investor need to buy the S&P 500 stock market index (measured in points)?

s&p 500/Gold-Ratio. How much gold is needed to buy an index? Source:macrotrends.net
In this chart, we can observe a slightly different pattern: yes, stocks still appear expensive. But not as expensive as in 2000 (at the time of the dotcom bubble). Currently, the S&P 500 index costs (pointwise) two ounces of gold. From 2009 to 2011 the index cost a lot less than now: at that time, this stock market index amounted to three quarters of a troy ounce of gold. In other words, in 2009 the stock market investor was the fortunate one. 2011 was, of course, the year in which precious metals prices peaked.
Nevertheless, we are currently at roughly the same level as before the 2008 crisis (at two troy ounces of gold). In 2000, the gold price stood at a cyclical and long-term low and stock markets at extreme cyclical highs: as a result, the S&P 500 / gold ratio rose up to 5:1 (!).
Silver seems to track the Goldman Sachs Commodity Index (GSCI) much better relative to the S&P 500 stock market index. Observe, for instance, the often-mentioned gold/silver ratio:

The gold/silver ratio. Source: Goldprice.org
Here we can see that gold is sometimes relatively expensive against silver: for instance in 2008, when the crisis erupted, or in 2015 when the silver price had an even tougher time than the gold price, or as now, as the gold/silver ratio stands at 81:1 (close to a historical peak as you can observe in the above chart).
This implies that silver can play an important role in your portfolio, as long as you look to profit from the information provided by the (GSCI) commodity index/S&P 500 ratio. Silver seems better positioned (read: relatively cheaper) compared to gold for the medium- and long-term.And What About Platinum?
In the context of all the above, an investor that wants to profit from the commodities = cheap trend should perhaps take a close look at the “ugly duckling” among precious metals: platinum. Undervalued, and even by us barely mentioned, but a metal that to a greater degree seems to have bottomed relative to the stock market. That means that platinum might turn out to be better correlated with the GSCI commodity index.
At any rate, it seems that we have arrived at a turning point in precious metals markets: the conclusions, however, have barely changed: stocks are (too) expensive, commodities are (too) cheap. Among commodities, gold seems to be a bit less favorably priced than silver and platinum. In an ideal scenario, you would – given the GSCI/S&P 500 ratio discussed earlier - sell your stocks and exchange them for gold, silver and platinum, after which you would not revise your portfolio for another decade. Because what will happen to precious metals prices when a crisis and a stock market crash occurs, might lead to “noise”: you might even panic and sell your silver and platinum, as they depend to a larger extent than gold on the macro-economic climate.
According to the first chart that we have seen (which contrasts a commodity index with a stock market index) you should have sold your precious metals already in 2008 before beginning to invest in stocks. You would have suffered lower returns for three years in a row (though avoided any losses), since precious metals prices peaked from 2008 to 2011. But that is a modest price to pay to avoid any large losses on the stock market (and commodity markets). And avoiding losses, rather than optimizing gains, is the key to long-term returns in excess of the market.