New oil shock collides with technical bottom signals for gold
The week started positively for gold, until Wednesday morning made clear that the ceasefire between the United States and Iran is over. After the warring parties exchanged attacks, oil prices began to rise, and with them interest rates and the US dollar.
Normally, gold and equity markets can absorb geopolitical skirmishes fairly well. Now, however, bond markets are gripped by the sense that central banks must conclude that Iran and the closure of the Strait of Hormuz are not a temporary problem.
Across the breadth of global bond markets we see yields rising and concerns growing, while the inflation problem had not yet been resolved. Now a new inflation and rate shock looms.
Bullish divergence collides with renewed macro pressure
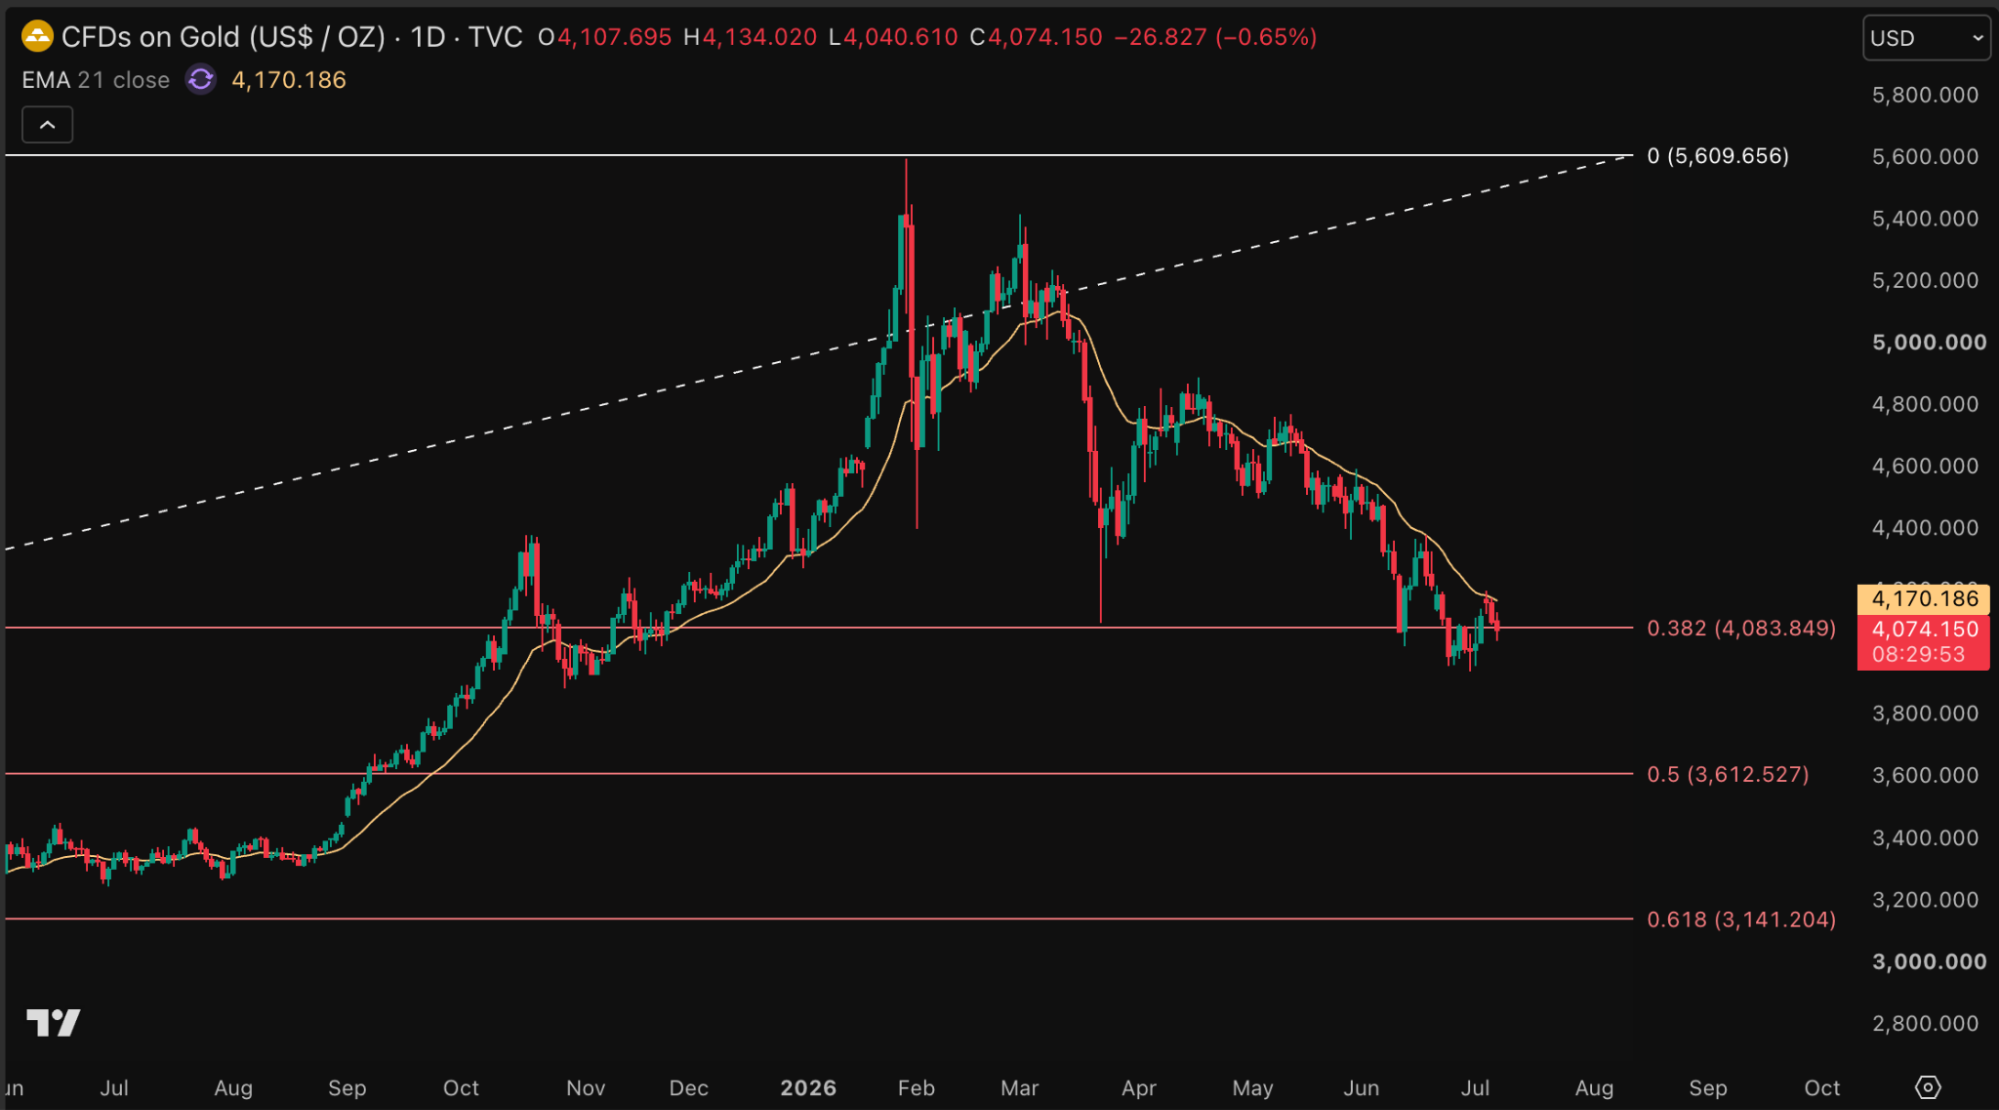
From a technical perspective in particular, the renewed focus on oil comes at an inconvenient time for gold. Over the recent period, increasing signs emerged that selling pressure was beginning to ease. Even now, the gold price continues to seek support around the 0.382 Fibonacci level of the rally from the 2022 low to the January 2026 peak.
That level sits around $4,084 per ounce and roughly marks the point at which gold has given back about 38 percent of its entire rally. Such Fibonacci levels are not an exact science, but on financial markets they often function as zones where buyers and sellers reposition.
Seeking support, but no breakout yet
In this chart we see gold indeed attempting to stabilize around this level. The price has recently climbed back above it, but is struggling to push through convincingly. The 21-day exponential moving average, currently around $4,170, also still forms a first resistance.
That keeps the technical picture fragile, though not without prospects. As long as gold keeps attracting buyers around the 0.382 Fibonacci level, there remains a chance that a temporary or even more significant bottom is forming here. A more convincing recovery, however, requires a break above the 21-day average and ultimately more distance from this support zone.
What the RSI is telling us
Alongside the support around the 0.382 Fibonacci level, we also see a bullish divergence forming for gold on the same daily chart. This occurs when price makes a lower low while the RSI makes a higher low. Since the RSI is a momentum indicator, this suggests that gold's decline is accompanied by weaker downward momentum.

This is generally a constructive signal. The price remains under pressure, but seller conviction appears to be fading. In other words, selling pressure is starting to weaken, while buyers are cautiously returning around key technical levels.
That makes it all the more unfortunate that a possible new oil and rate shock is emerging right now. That combination supports the US dollar and puts renewed short-term pressure on gold. As a result, the technical recovery remains fragile, despite the improvement visible in momentum.
For now, the picture therefore remains mixed. The bullish divergence gives reason for cautious optimism, but a more convincing recovery requires further confirmation. The 21-day exponential moving average around $4,170 remains a key first hurdle.
Still a silver lining for gold
In theory, there is also a scenario in which the recent market dynamics could turn out positive for gold. In the short term, that is not immediately obvious. Rising interest rates usually go hand in hand with a stronger US dollar and therefore act as a headwind for the gold price. Over a slightly longer horizon, however, the picture could change.
The risk to the AI complex
The rise in bond yields poses a particular risk to the AI complex. Many AI-related stocks have the character of long-duration assets. These are companies where a large share of expected profits lies further in the future, making valuations more sensitive to higher rates. It is precisely there that a new energy shock could cause the most damage.
In terms of timing, the renewed tensions surrounding Iran therefore come at a vulnerable moment. Before the end of the ceasefire was announced, the biggest winners within the AI complex were already under pressure, and we saw significant price declines.
On top of that, doubts are growing over whether these companies can sustain the enormous profit growth of recent months and years. The market still has confidence in the AI story, but appears no longer willing to buy in at any price.
Investors are becoming more selective
Investors are becoming more selective. AI companies with more attractive valuations continue to find support, while more expensive names are avoided more often. That in itself is not a problem, but selectivity is not the same as broad risk appetite.
Under calm market conditions, a rotation from expensive AI stocks into more reasonably priced alternatives can be healthy. In an environment with an oil shock, rising rates and a stronger US dollar, that same rotation becomes more fragile.
Room for gold as a safe haven
Should this lead to a sharper correction in chip indices and other AI-related stocks, room could open up for gold to take over some of the momentum. For that, it is important that gold holds up relatively well during the oil shock and any renewed tightening of central bank policy.
The silver lining is therefore primarily a relative one. Gold does not need to rise sharply right away to become more interesting. If pressure on AI stocks increases while gold shows stability at the same time, the narrative could gradually shift from growth and euphoria toward protection, diversification, and therefore toward gold.
Tensions between the US and Iran are pushing up oil prices and interest rates, putting pressure on gold. Yet the charts show signs that gold is searching for a bottom.

Thom Derks writes for GoldRepublic on gold, macro-economics and geopolitics. He studied Law in Leiden and Economics in Amsterdam. His personal fascination with scarcity and store of value through both bitcoin and gold brought him into the world of financial journalism. Through his own newsletter De Geldpers on Substack, he reaches over 5,800 subscribers with analyses on markets, geopolitics and the monetary system.