Iran war resumes, oil price surges: this is the level gold can't afford to lose
Last week, Donald Trump suddenly announced that the ceasefire between Iran and the United States is over. Shortly after, renewed attacks followed on both sides. At first, financial markets seemed barely affected.
The oil price barely reacted, gold and silver held steady, and stocks also stayed relatively stable. A few trading days and a weekend later, though, the picture looks completely different. The oil price started climbing sharply Monday morning, while gold and silver came under pressure and Wall Street futures opened in the red.
Negative in the short term, positive in the long term
In the short term, the resumption of the Iran war is clearly a negative for gold. The escalation is pushing up inflation expectations and bond yields, and typically strengthens the US dollar as well.
For gold, that's an unfavorable combination. The precious metal pays no yield, making it less attractive when investors can earn higher returns on bonds.
Although a Brent oil price of around $78 a barrel isn't yet a direct economic problem, what matters most is the signal it sends. The renewed conflict means financial markets are once again facing a period of uncertainty, particularly around the path of inflation and interest rates.
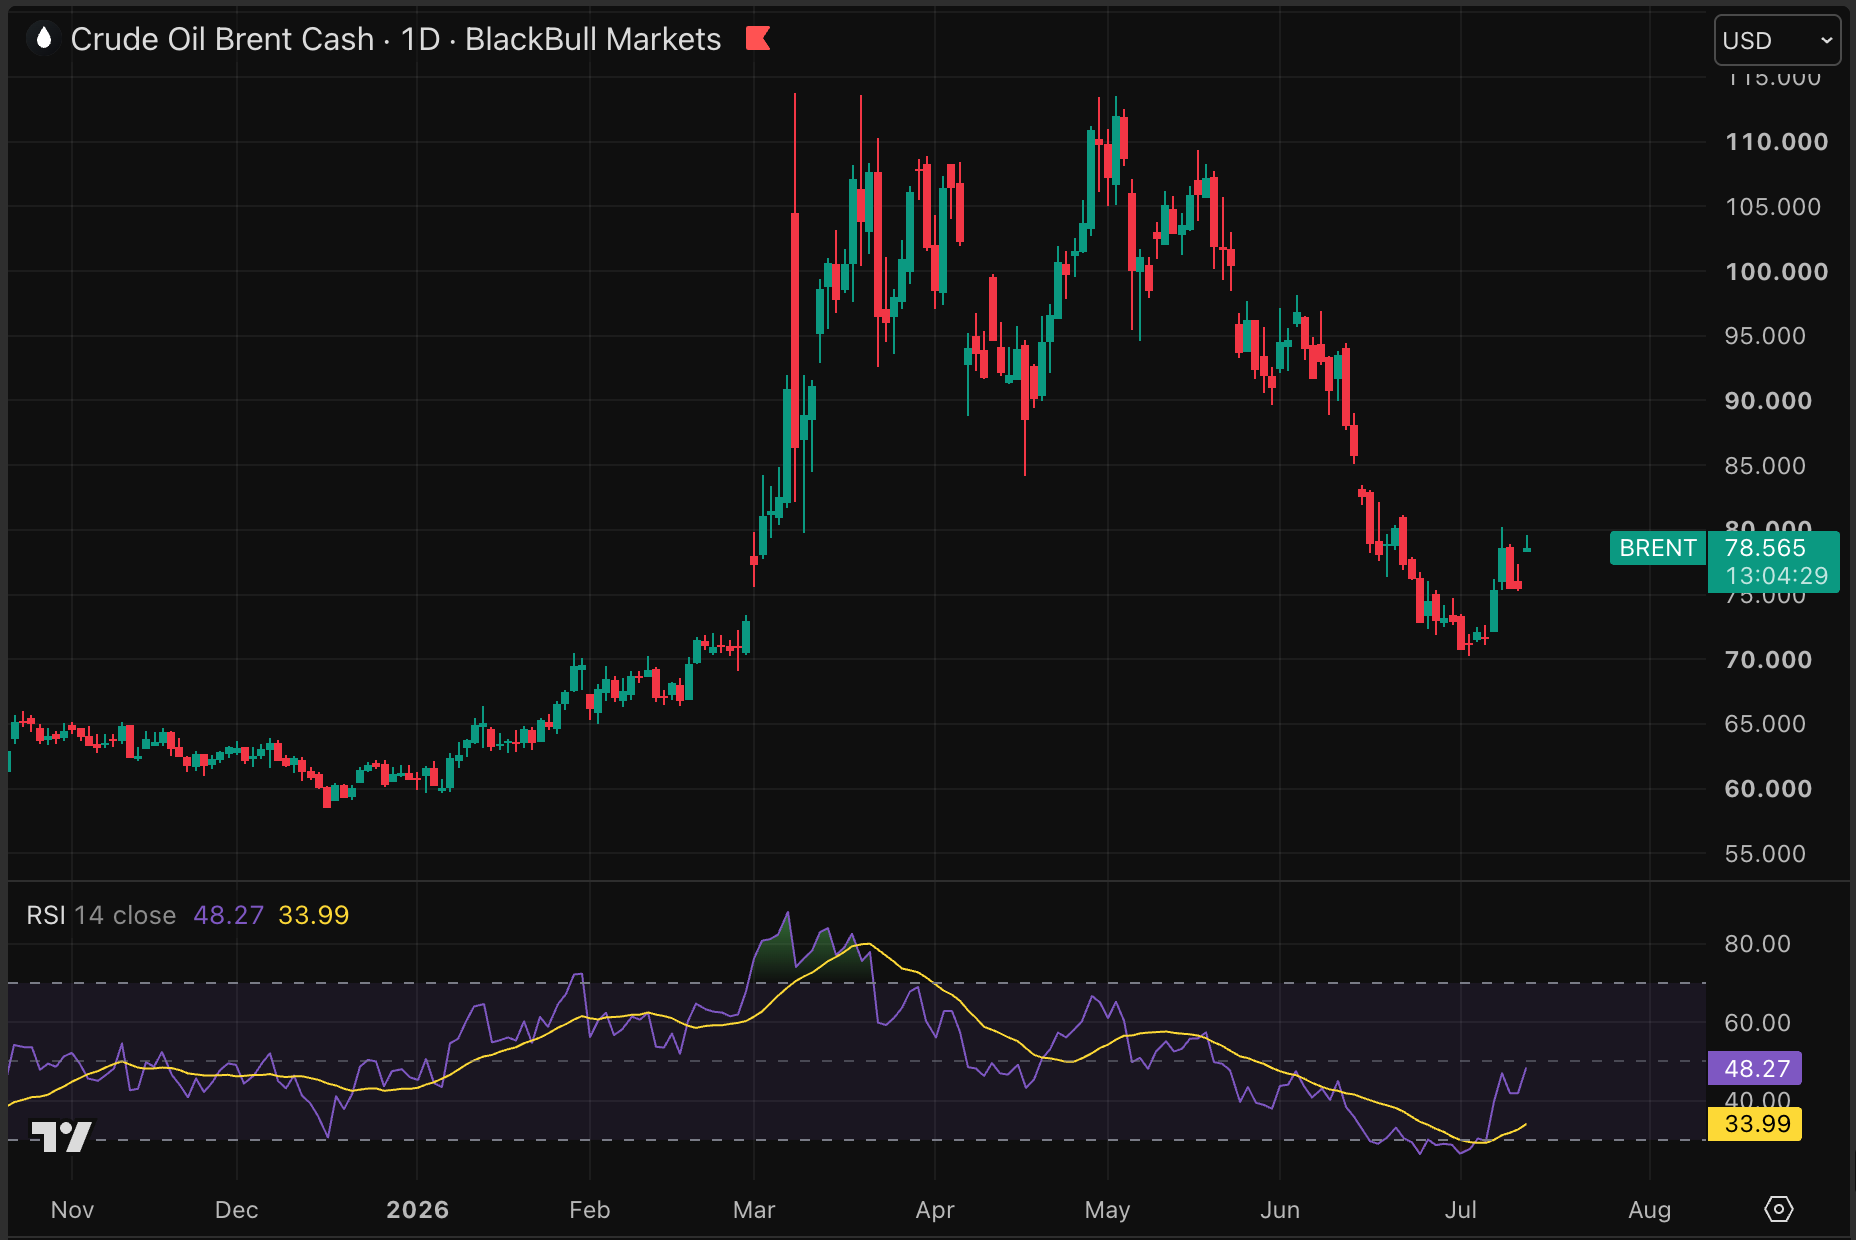
This fresh uncertainty comes at an unfortunate time for gold. The metal had only just started showing tentative signs of bottoming out, after falling around 30% since its January 2026 peak.
At the same time, there's no reason for panic yet. Gold is still trading between $4,000 and $4,100. That zone has repeatedly acted as key support in recent weeks. As long as these levels hold, gold could still be in the process of forming a bottom.
Over the longer term, the war with Iran could actually turn out to be positive for the gold price. Wars are typically financed largely through new debt. The United States is already on track for a budget deficit of roughly $1.6 trillion for the current fiscal year. At the same time, annual interest payments on the national debt now exceed $1 trillion.
A prolonged war with Iran would likely add further pressure. The US government would need to borrow more, potentially widening the budget deficit further. There's also a risk that higher inflation and bond yields could slow economic growth.
That could also have consequences for investment in the AI complex. Higher financing costs make large-scale infrastructure projects less attractive and could put pressure on tech company valuations.
If the economy moves toward a recession as a result, the odds increase that the government and the US central bank will need to step in again. That could happen through lower interest rates, additional government spending, or other forms of monetary and fiscal support.
It's precisely this combination of rising debt, loose monetary policy, and growing uncertainty that supports gold's investment case over the longer term.
Gold price needs to hold this support
Gold would send a particularly strong signal if, under current conditions, it manages to hold support around the 0.382 Fibonacci level at $4,073. At the time of writing, the gold price is trading almost exactly around that level.
Although short-term conditions have clearly become more uncertain, today's price decline is relatively modest. That in itself is a sign of strength.
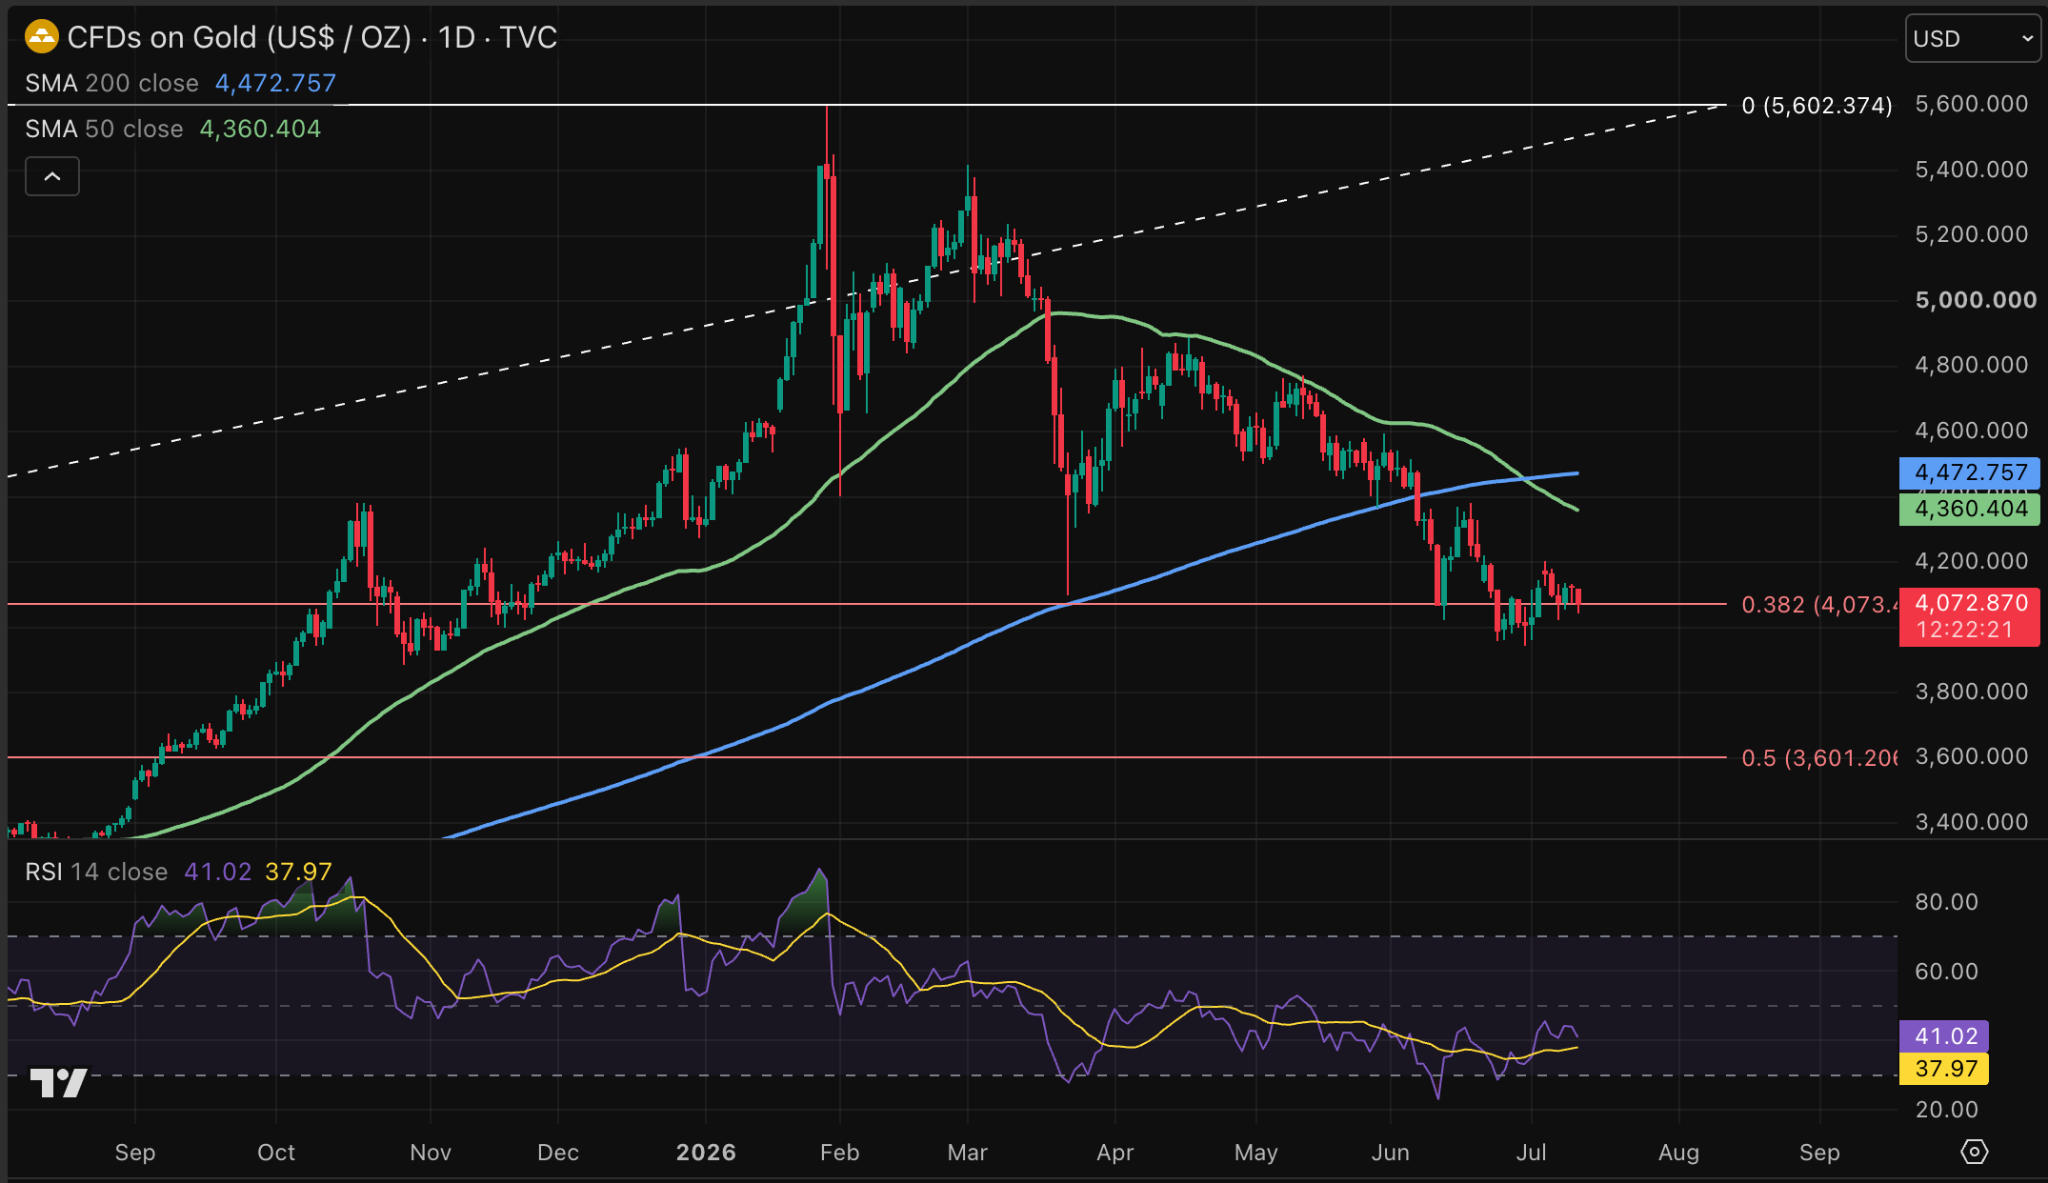
Losing this support would open the door to a further decline toward $3,600 an ounce. For now, though, that's not the case.
At the same time, the same chart is showing a bullish divergence. That happens when the price sets a lower low while the Relative Strength Index (RSI) forms a higher low.
So the gold price fell further, but the strength and conviction behind that decline weakened. That's typically a sign that sellers are gradually running out of steam. In theory, that reduces the odds of a deeper decline. Given the current macroeconomic uncertainty, though, that possibility can't be entirely ruled out.
For now, gold is once again finding support above $4,000. That fits with the picture of easing downward pressure, with the market possibly in the process of forming a bottom.
To genuinely return to a bull market, gold still has a lot to prove. A first important step is reclaiming the 50-day moving average around $4,360. After that comes the 200-day average at roughly $4,472.
If gold manages to reclaim both levels and the 50-day average then turns from a downtrend to an uptrend, it could cautiously be concluded that the bull market is returning. For now, though, gold is still searching for the definitive end of the mini bear market.
The Iran war has resumed and oil prices are rising, putting gold under pressure. Around $4,000 lies a crucial support level gold must now hold.

Thom Derks writes for GoldRepublic on gold, macro-economics and geopolitics. He studied Law in Leiden and Economics in Amsterdam. His personal fascination with scarcity and store of value through both bitcoin and gold brought him into the world of financial journalism. Through his own newsletter De Geldpers on Substack, he reaches over 5,800 subscribers with analyses on markets, geopolitics and the monetary system.